...
- In the Navigation Menu, click on Presentations and Pages

- Add a new page called Dashboard View of Category General and Template Blank
- Click Save and launch the Page Builder
- Add a Unified Store called storeDash
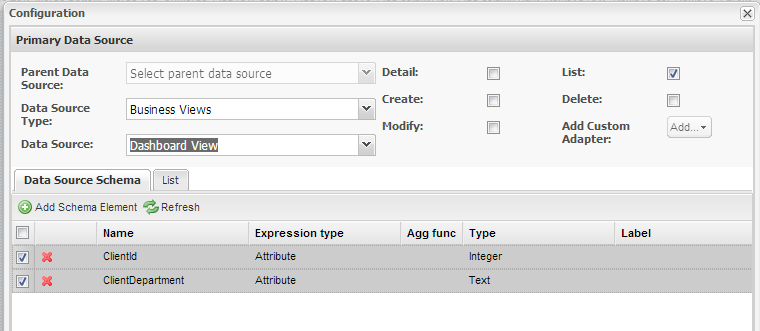
- Edit the Properties: set its Data Source Type to Business Views and the Data Source to Dashboard View
- Check the List checkbox
- Remove the element called Id, so that the only elements left are ClientId and ClientDepartment
- Click Save
- Into pnMain add a Chart Dashboard
 and call it chartDepartmentCount
- Click Settings to configure the chart
- Click the Existing radio button for Store Type
- Select storeDash[List] as the Store adapter
- Click Apply
- Click on the Dashboard Settings tab
- Select Chart from Dashboard Type
- Select ColumnChart from Chart Type
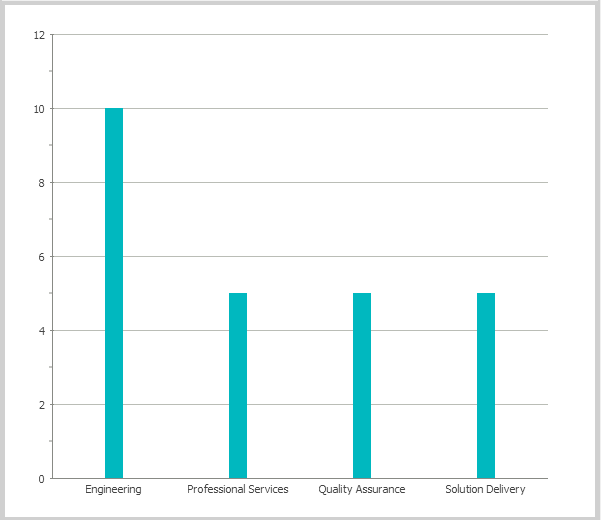
- Set the XAxis to ClientDepartment
- Set the YAxis to ClientId
- Click Save
- Click the Preview tab to see a preview of your chart
- Click Settings to configure the chart
- Click Save Page at the top left of the screen; click Ok to the Page was saved pop-up.
- Add this page to your application, deploy, log out and log back in to view it as part of your solution.