You are viewing an old version of this page. View the current version.
Compare with Current
View Page History
« Previous
Version 2
Next »
Step 1 – Create a Group By View
- In the Navigation Library, go to Data Management and then go to Views

- Click New View and call it Dashboard View; set Primary Object to Client; click Save
- Click on the Fields tab and move the Client.Department and Client.Id fields into the panel on the right
- Click on the Gear icon at the left of the Client.Id field to see the Linked field properties pop-up
- Set the Function field to Count
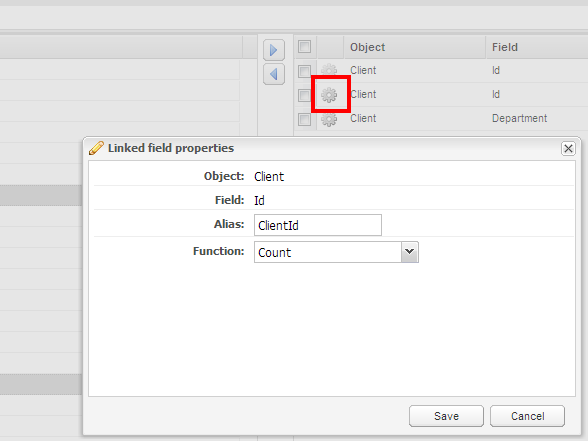
- Click Save
- The SQL text will look like this: select A0.COL_ID ID, Count(A0.COL_ID) CLIENTID, A0.COL_DEPARTMENT CLIENTDEPARTMENT from TBL_CLIENT A0 group by A0.COL_ID, A0.COL_DEPARTMENT
- We need to edit it because we aren't counting by both ID and Department, only Department; thus we removed all references to A0.COL_ID
- The result will be this: select Count(A0.COL_ID) CLIENTID, A0.COL_DEPARTMENT CLIENTDEPARTMENT from TBL_CLIENT A0 group by A0.COL_DEPARTMENT
- Click Save
- Deploy your solution, log out and log back in.
Step 2 – Debug the View as a Rule
- In the Navigation Library, go to Business Rules and click on Rules

- Find the Dashboard View and click on the debug icon

- Click on Run

- This rule will run on dummy data added through the previously built pages and should look something like this
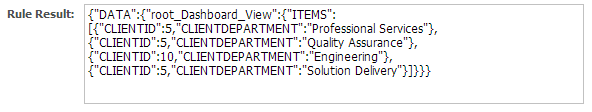
- CLIENTID displays the count of the number of client id's associated with each of the 4 departments
Step 3 – Debug the View as a Rule
- In the Navigation Menu, click on Presentations and Pages

- Add a new page called Dashboard View of Category General and Template Blank
- Click Save and launch the Page Builder
- Add a Unified Store called storeDash
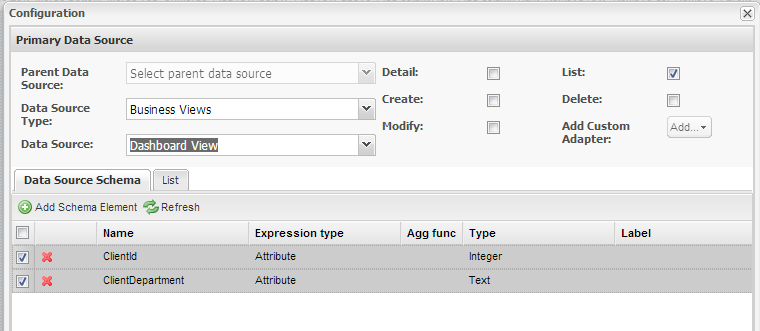
- Edit the Properties: set its Data Source Type to Business Views and the Data Source to Dashboard View
- Check the List checkbox
- Remove the element called Id, so that the only elements left are ClientId and ClientDepartment
- Click Save
- Into pnMain add a Chart Dashboard
 and call it chartDepartmentCount
- Click Settings to configure the chart
- Click the Existing radio button for Store Type
- Select storeDash[List] as the Store adapter
- Click Apply
- Click on the Dashboard Settings tab
- Select Chart from Dashboard Type
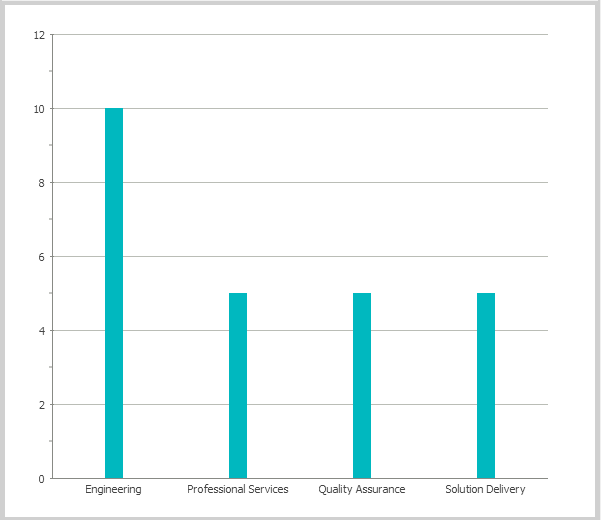
- Select ColumnChart from Chart Type
- Set the XAxis to ClientDepartment
- Set the YAxis to ClientId
- Click Save
- Click the Preview tab to see a preview of your chart
- Click Save Page at the top left of the screen; click Ok to the Page was saved pop-up.
- Add this page to your application, deploy, log out and log back in to view it as part of your solution.